Definition
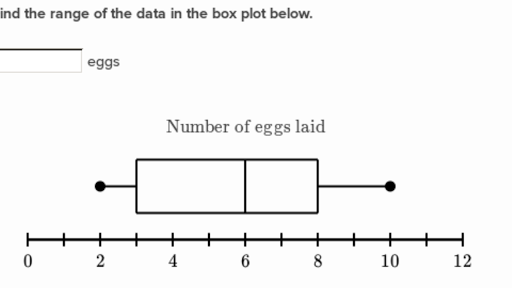
Box plot is a graphical representation done with one bar segmented, one line and sometimes two dots; it can be plotted in one-axis (as a single graphic representation) or two-axis, if there's more than one category or group of data being presented.
Usefulness
Box plots are a good way of presenting a more accurate picture of a data set.
1 It gives the audience a chance to see the extent of a full data set, by plotting it out with the line its lowest and biggest value.
2 It can show how truly all the data points are spread over its range, by defining its median value, which can be more useful over just showing the mean value. It is done by marking it on the bar.
3 It packs a lot of data points within small amounts of graphic information.
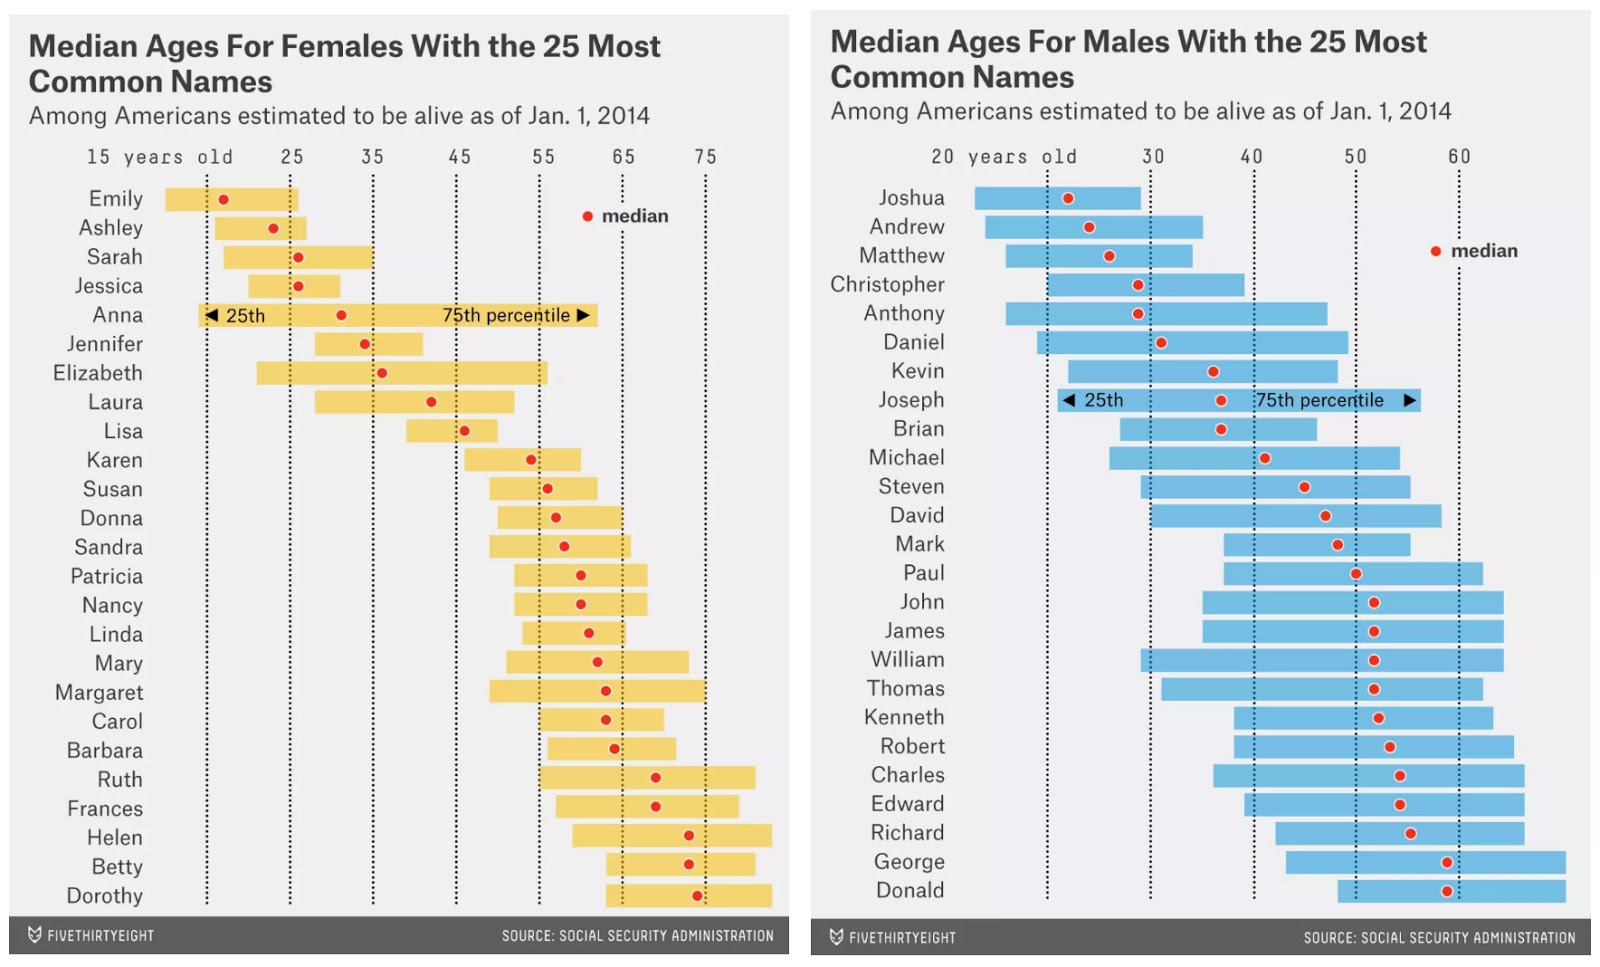
You can also abstract the model a little bit, so its usefulness really shines with data sets where a long range of data points is presented, such as the one below:
Downfalls
1 Box plots are not as usual and demand some background in statistics to get some kind of insight from them.
2 They do seem to rely more on explanations and peripheral text, so a good balance between how much you describe with words vs images seems a valid concern.