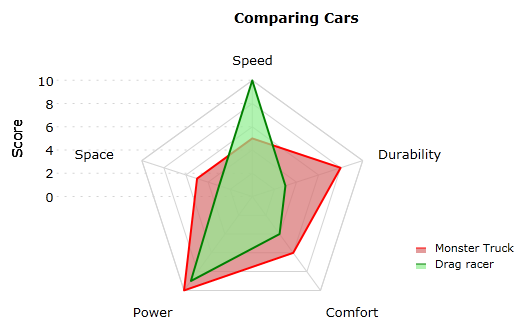
Three types of charts will be examined:
1) Parallel Coordinates
2) Radial Parallel Coordinates, and
3) Star Plots
Parallel Coordinates
Description
Parallel coordinates are used to convey relations between various characteristics that share the same data type (units). In the below example Figure 1, three species of what appears to be some kind of plant are compared by their sepal width, sepal length, petal width and petal length (presumably in centimeters).
Figure 1.1: Good Example (Readable)

Figure 1.2: Bad Example (Unreadable)

Star Plots
Description
Star Plots use a radial visual plot instead of vertical parallel lines.
Figure 2.1: Good Example (Correct Usage)

Figure 2.2: Bad Example (Incorrect Usage)

Radial Parallel Coordinates
Description
Radial Parallel Coordinates superimpose multiple star plots on top of each other.
Figure 3.1: Good Example (Straight-forward)

Figure 3.2: Bad Example (Not straight-forward)

Figure 3.3: Evolved Example (With Personality)

Conclusion
Good for:
* Measurements
* Rankings
* Characteristics
* Comparing the above between comparable items
Bad for:
* Excess number of comparisons
* Plotting different incongruous types together