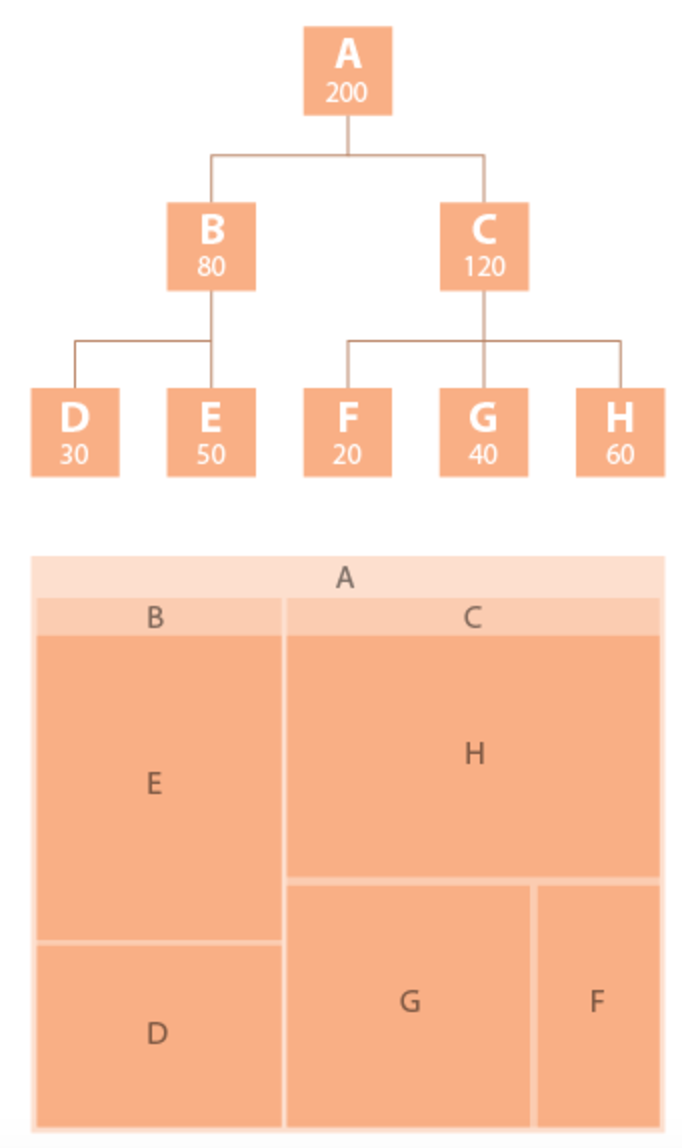
A tree map shows a hierarchy, and shows both categorical data and quantitative values as parts of a whole. The two main uses of a tree map are for getting a quick overview of a complete hierarchy, and for comparing part of whole relationships within the hierarchy.
Raw numeric data must be transformed to an area size. This is displayed in proportion to that quantity and to the other quantities within the same parent category. Different tree map algorithms may allocate & display slightly differently.
The most common tree maps forms are rectangular in shape. Color can be used to signify increases or decreases in value.
Treemaps are not good when there is a big difference in the magnitude of the measure values. Treemaps do not mix absolute and relative values.
Negative values cannot be displayed in treemaps.
Example of a hierarchial tree, followed by a tree map, to illustrate how a tree map is formed.
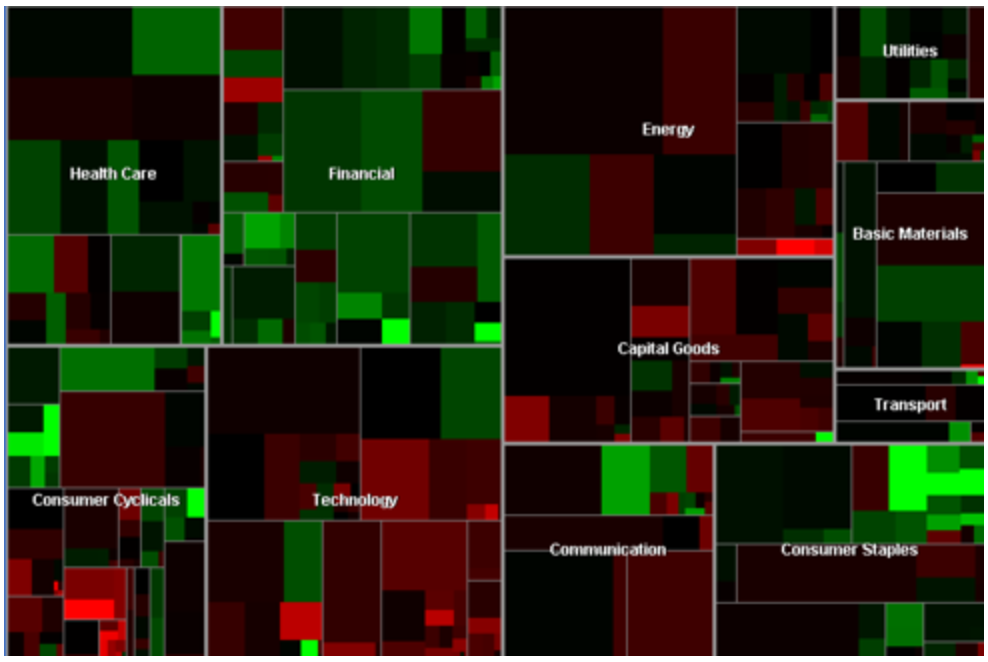
Good Example:
Martin Wattenberg's "Map of the Market" depicts a hierarcically ordered set of boxes within boxes for the sectors, and largest stocks in the market.
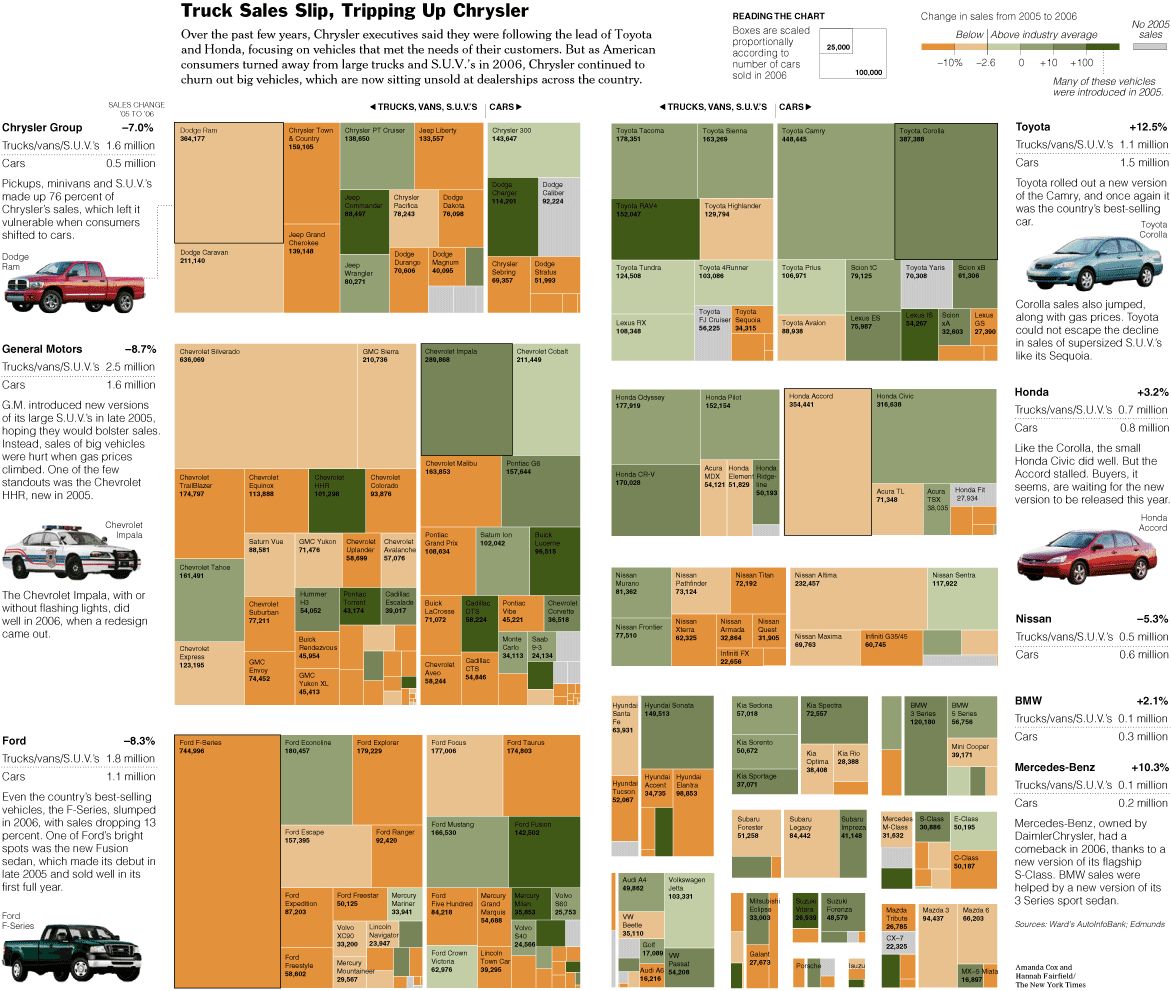
Cars:
Poor Example:
Thanksgiving:
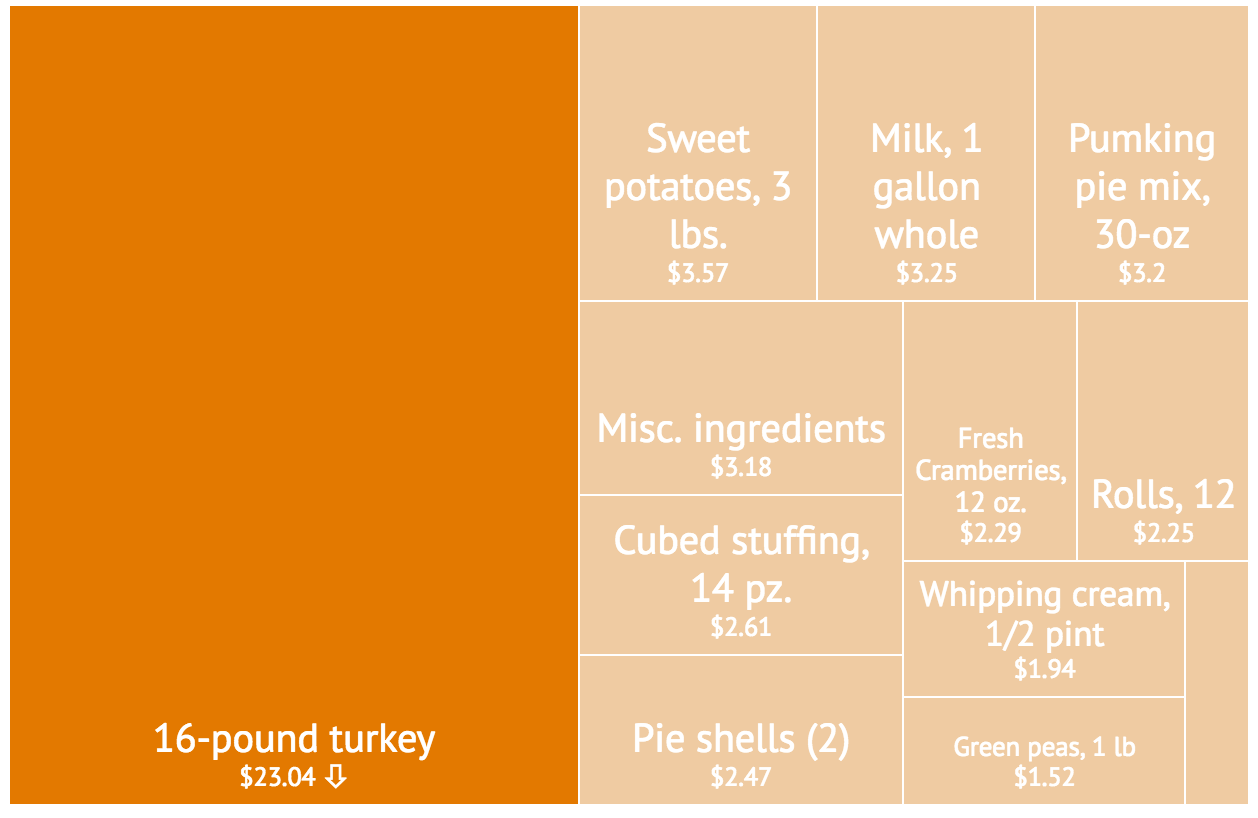
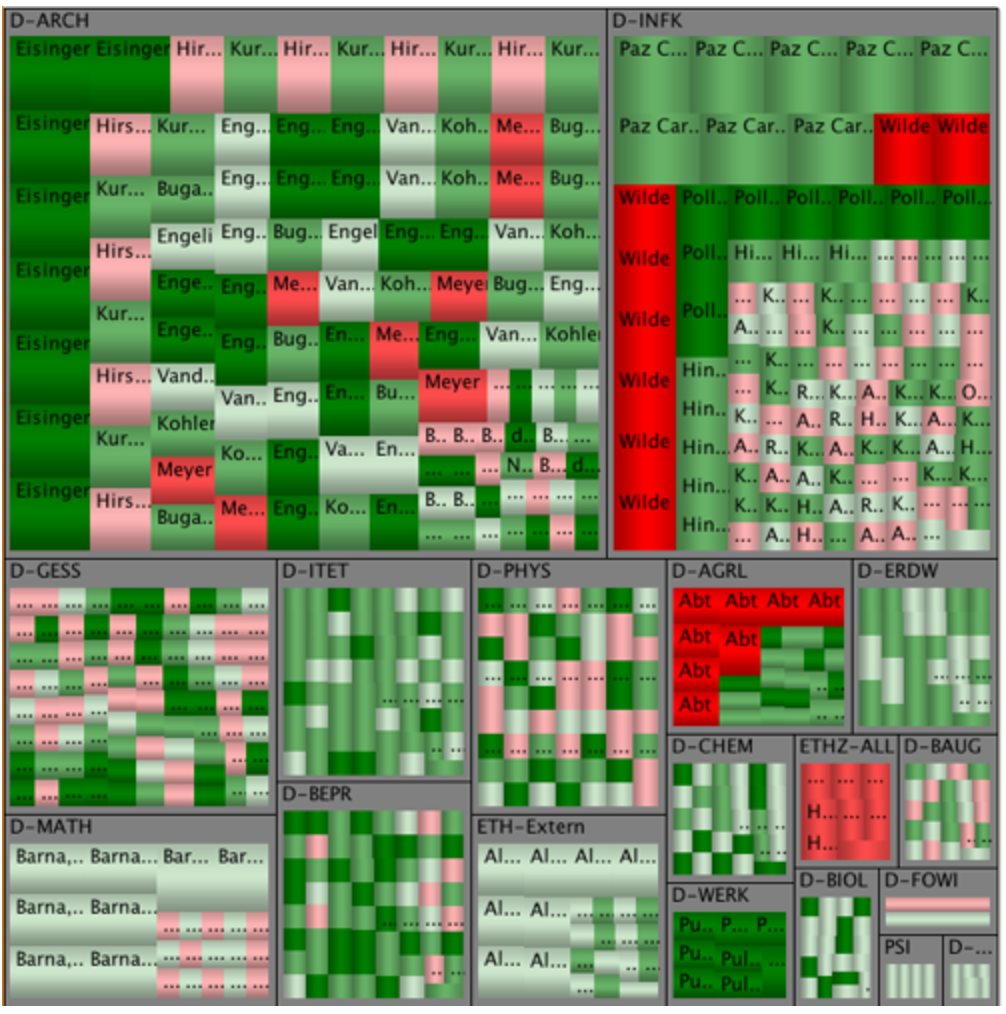
Suffers from poor labeling